Calculus Methods
11 Curve Sketching
You should do steps 1 and 2 for every problem.
The other steps you would use as necessary to finish
a sketch. Other than steps 1 and 2, there is no
particular order for the other steps.
1)
Find Intercepts (set ![]() and solve for
and solve for ![]() ; set
; set ![]()
and solve for ![]() ).
).
2) Find Relative Extrema and Points of Inflection
(see method 08 and method 09).
3) Find Asymptotes (vertical asymptote occurs
when denominator of the fraction equals 0;
horizontal asymptote occurs when the limit at
infinity (see method 10) equals a constant value).
4) Find Concavities (to fill in the curvature: where
is the function concave up and when is it concave
down? Use a sign chart (see method 02) on the
second derivative!).
5) Check Continuity (what is the domain of the
function? for piece-wise defined functions, do the
pieces match up?)
6) Find Domain and Range.
7) Check Symmetry (is the function even, odd, or
neither?).
8) Check Differentiability (where does the
derivative exist? For continuous piece-wise defined
functions, is it smooth or is there a cusp?).
Example
#1: Sketch ![]() .
.
1)
When we set ![]() , we find
, we find ![]() , so we know that
, so we know that
one intercept is ![]() . When we set
. When we set ![]() ,
we have a
,
we have a
cubic equation, which is not easy to solve so we will
either use our calculators to solve it, or we will just
check where our x-intercepts are later to see if they
are approximately correct.
2)
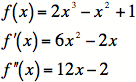
Finding critical numbers:
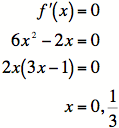
Checking critical numbers:
![]() , so the test fails and we need to use a
, so the test fails and we need to use a
sign chart (see method 02). After we use the
sign chart, we see that ![]() is a maximum
is a maximum
and ![]() is a minimum. Therefore we have
is a minimum. Therefore we have
two
more points: ![]() is not only an
is not only an
intercept, but it is also a maximum, and
![]() is
a minimum.
is
a minimum.
"Other" points of inflection:

But
we already know that ![]() is not a
is not a
critical point, so it must correspond to the
point of inflection ![]() .
.
Our current information, then, is that we have an
intercept and a maximum at ![]() , a minimum at
, a minimum at
![]() ,
and a point of inflection at
,
and a point of inflection at ![]() . At this
. At this
point, we try to graph the function without doing
any more work.
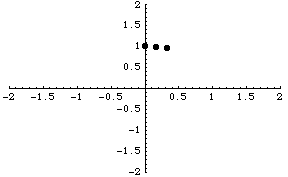
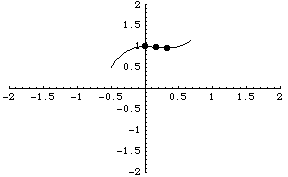
Given that the first point is a maximum, the second
is a point of inflection, and the third is a minimum,
we can start to draw in the function:
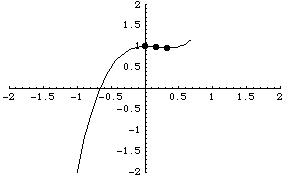
Now we can finish, because we know that
concavity never changes, except when ![]() . So
. So
since the function is concave down
when ![]() , it
, it
must be concave down everywhere
before ![]() :
:
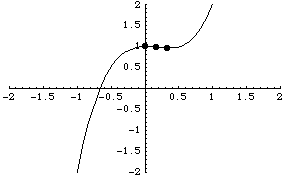
Similarly, the rest of the function must be concave
up:
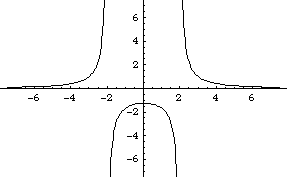
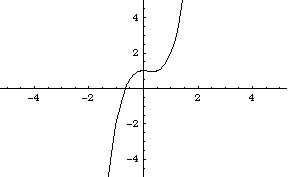
Zooming out, the whole function looks like this:
Example
#2: Sketch ![]() .
.
1)
When ![]() , we find that
, we find that ![]() . When we try to
. When we try to
set ![]() , we end up with the contradiction
, we end up with the contradiction ![]() , so
, so
there are no x-intercepts. Our only intercept is the
y-intercept ![]() .
.
2)
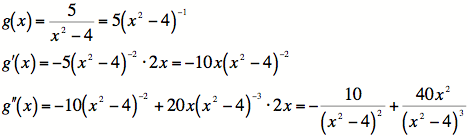
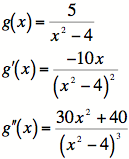
We know we will need the first and second
derivatives as single fractions, so we end up:
Finding critical numbers:
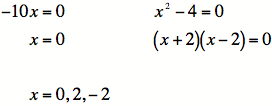
Finding
critical points: ![]() only. The function
only. The function
is undefined at ![]() and
and ![]() .
.
Testing the critical point:
![]()
So
we have a single extremum: ![]() is a
is a
maximum.
Finding "other" critical points:
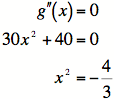
Which never happens for real numbers. So
there are NO points of inflection!
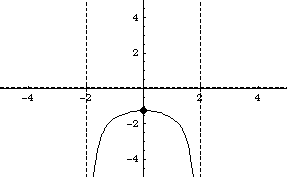
At this point, we will try to graph the function
without doing any more work:
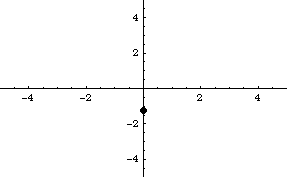
We know that this point is a maximum, so we
can draw in some curvature to it:
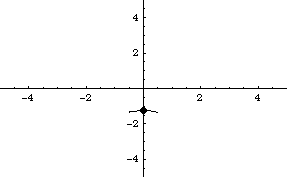
Unfortunately, this does not help us a great
deal, so we must look at other evidence that
we have.
3) We should have vertical asymptotes where the
function has zeroes on the bottom: this happens
when ![]() . Checking
the limit at infinity (see
. Checking
the limit at infinity (see
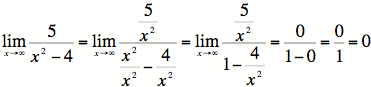
So
we have a horizontal asymptote of ![]() for
for
both positive and negative values of the function.
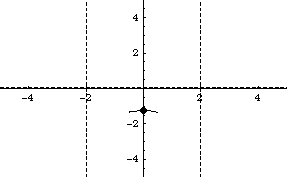
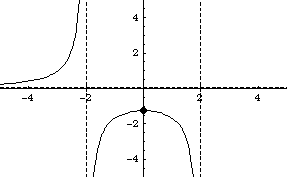
Since we know the function has no y-intercepts
and it doesn't change concavity at any point in
the function's domain, we can draw in the rest
of the center portion of the graph.
Now we must determine what the rest of the
graph looks like. One of steps we have not yet
tried is to look at the concavity. We know that
there are no points of inflection, so in any
region, the concavity cannot change. When
![]() , for instance, we see that the
concavity is
, for instance, we see that the
concavity is
![]() . Therefore the graph
must be
. Therefore the graph
must be
concave up at this point, and thus must also be
concave up in that entire region. Note that this
also means we must be in the upper-left region,
since the graph cannot exist in the lower-left
region and be concave up!
To finish the graph, we can either follow the
same procedure to look at a region on the right,
or we can note that the function is even, and
thus must have symmetry across the y-axis:
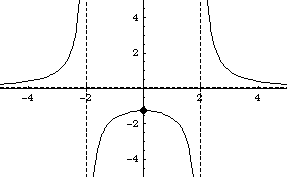
Cleaning up, we see our sketch of the graph: